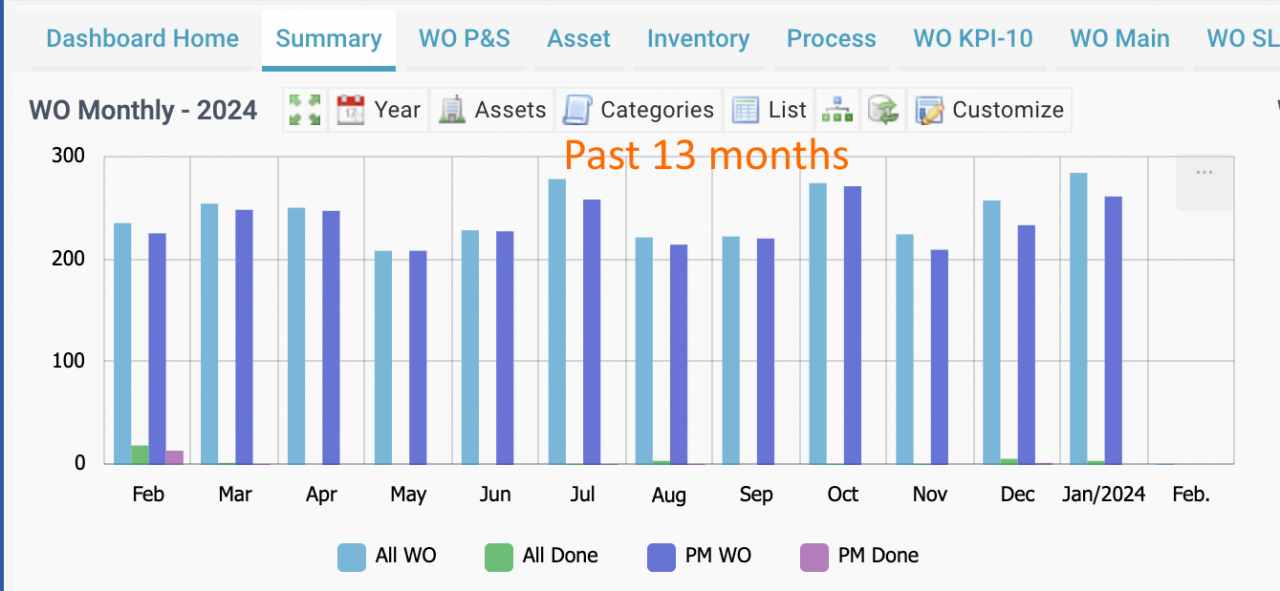
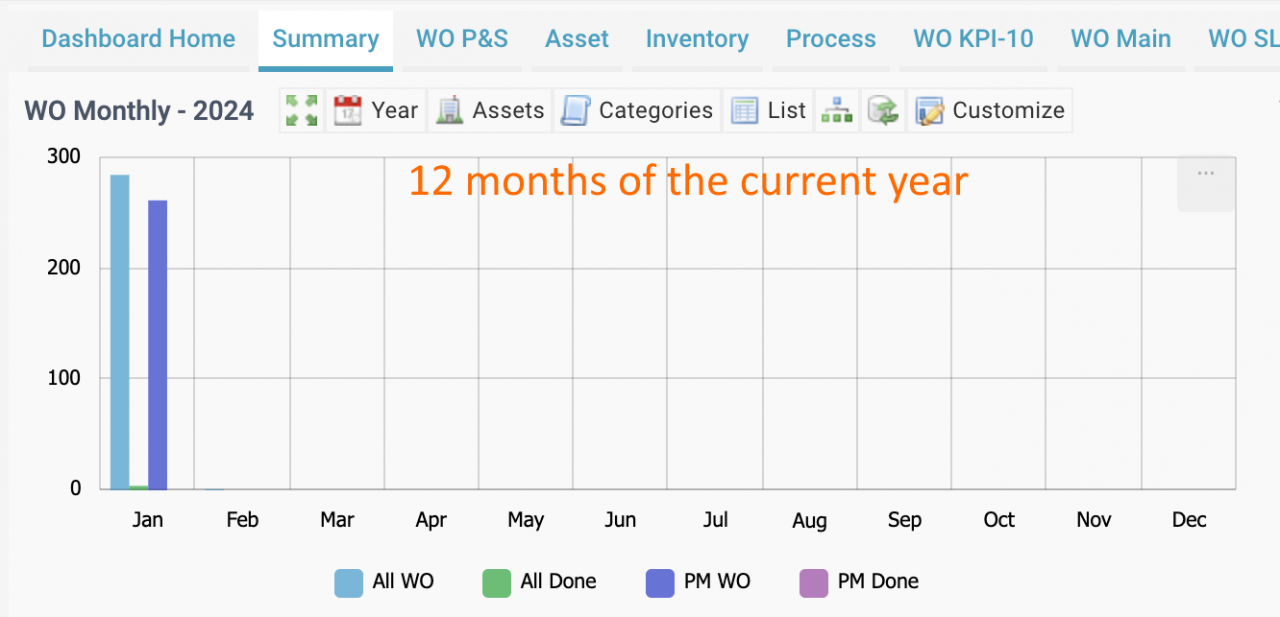
Work Order Monthly KPIs for the past 13 months will be available in the coming release of R2024 . It delivers more insights than the KPIs for the 12 months of the current year. The first screenshot is the monthly charts for the past 13 months. The next screenshot is for the current year.
- This feature may be extended to other monthly KPIs in Calem in future releases.
- List views of monthly KPIs (from "List" menu of the dashboard) will not be affected. They will show the KPIs for the current year.
1. WO Completed in WO Monthly vs WO Analysis
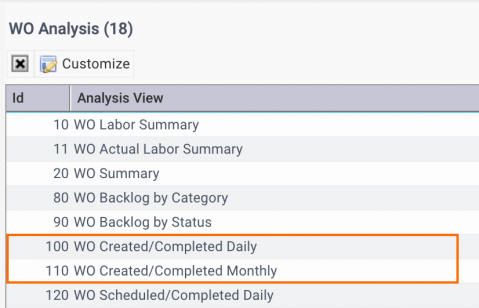
Work orders completed are calculated differently in WO Monthly of Dashboard and in Analysis module.
- WO Monthly counts work orders completed for a month by its creation time.
- WO Analysis counts work orders in a month by its completion time.
- The same goes for the WO completed in a day.
- One may use the metrics for different purposes.
- "WO Monthly" shows how many WOs created in a month are completed.
- WO completed in Analysis reveals the number of work orders completed for a day or a month regardless when they were created.
Resources
- A Review of Work Order Summary KPIs
- Multi-Site KPIs for Inventory
- WO Plan and Schedule KPIs in R21f
- How to Manage Resource Schedules
- How to Report Labor Hours in Work Orders
- How to Do Weekly Schedules by Teams
- Work Order Summary KPI
- PM Module Training
- Dashboard Module Training
- User Guide and Admin Guide (customer account required)
- Calem Enterprise Training Site
- Calem Enterprise Blogs
- Calem Enterprise demo


