Calem Blogs
Blogs of CalemEAM
Purchase KPI A: Item Price and Overspend
Purchase performance KPIs are available in the coming release of R2025f (August 2025). They surface top price hikes and overspendings so outliers can be easily spotted. The metrics are calculated for all inventory so one can export the metrics for deep analysis.
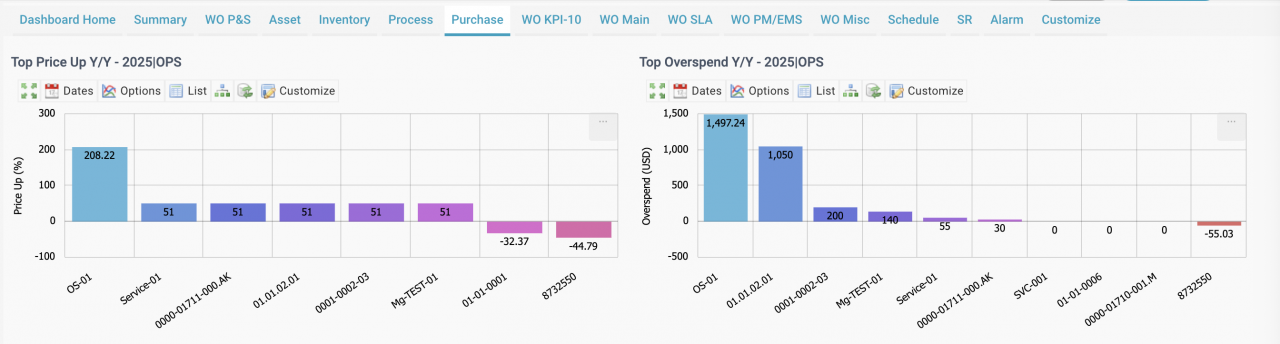
1. Price Up Y/Y
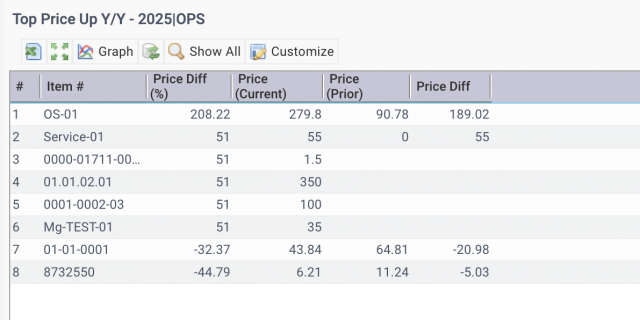
This KPI shows the increase of average prices (weighted average prices with quantities) of current year from previous year.
- Top 10 items are shown with the highest price increases.
- List view shows the average prices of current and previous years. Positive Price Diff (%) is price increases, and negative price reductions. Click an item row to drill down to transactions.
- A percentage of 51 is used for an item that does not have a price for a prior year.
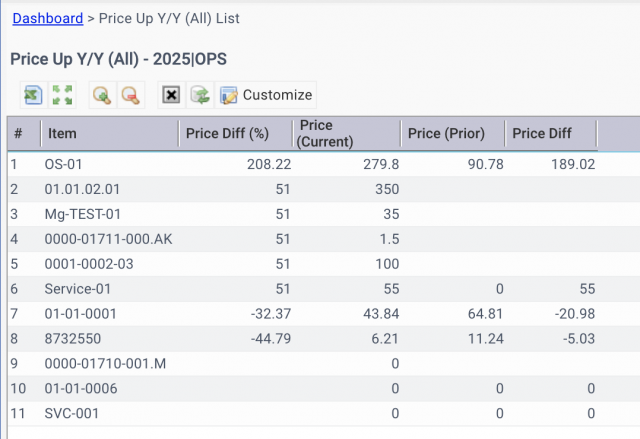
- "Show All" menu in the List view shows all items with price increase information. Exporting the data to excel for further analysis. Click an item row to drill down to transactions.
- Multi-Site drill-down is available - see this blog for an introduction of multi-site drill-down.
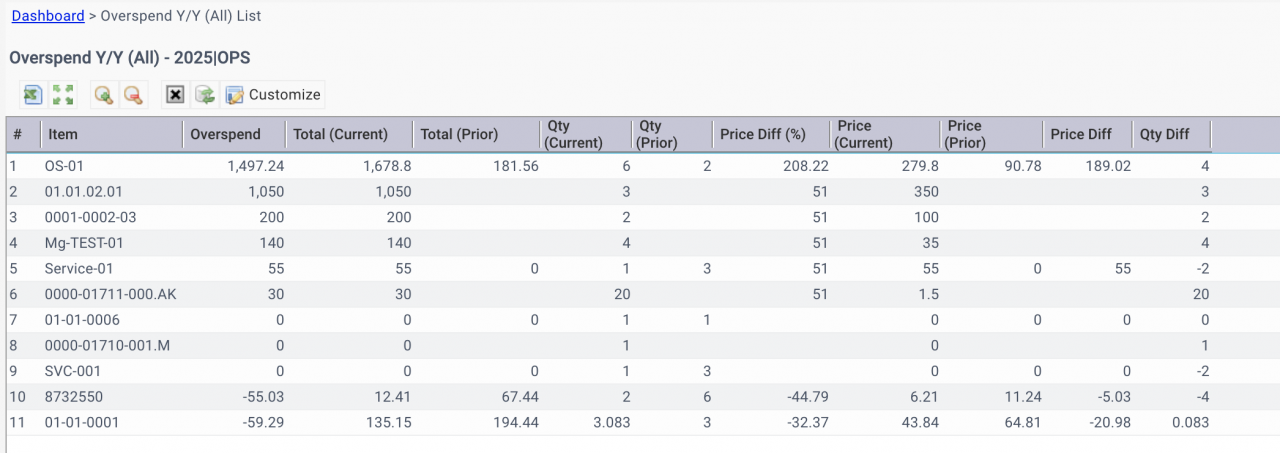
2. Overspend Y/Y
This KPI shows the increase of total spend per item of current year from previous year.
- Top 10 items are shown with the highest overspend.
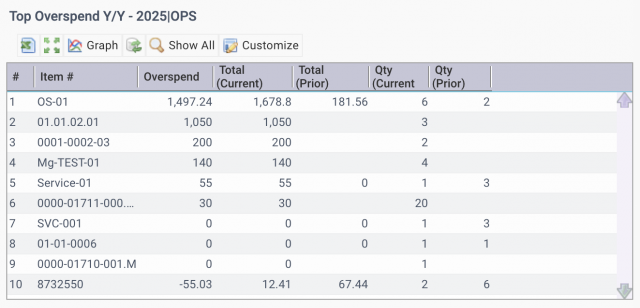
- List view shows total expenditure of current and previous year per item. Positive overspend are increases from last year, and negative reductions. Click an item row to drill down to transactions.
- Show All menu will list all items with overspend information. Exporting the data to excel for further analysis.
- Multi-Site drill-down is available - see this blog for an introduction of multi-site drill-down.
KPI Resources
- Multi-Site KPIs for Inventory
- Multi-Site KPIs for Maintenance
- Bulk Update by Export and Upload
- Instance Dashboard and Home Pages
- Part Repair Processes in Calem
- How to Track Asset Off-Site Repairs
- How to Use Price Lot in Calem
- Work Order Life-Cycle Diagrams
- Asset Tracking in Calem
- User Guide and Admin Guide (customer account required)
- Calem Enterprise Training Site
- Calem Enterprise Blogs
- Calem Enterprise demo
About the author

By accepting you will be accessing a service provided by a third-party external to https://calemeam.com/