Calem Blogs
Asset KPIs by Class (Categorization)
The asset KPIs by assets are replacing the KPIs by classes from release R2023c. The KPIs by asset classes are deprecated.
- The definition of KPIs are valid excepting ones that are deprecated which are noted with "(Deprecated)".
- See this blog for updated KPIs.
New asset Key Performance Indicators (KPI) have been added in Calem Enterprise R11. They are calculated for a date range and grouped by asset class. These KPIs are listed below.
- Some KPIs including D and E are not shown by default. Admin can customize the dashboard to show them if applicable.
| Assets |
| A. Mean Time Between Failures (MTBF) = OH/count of CM Up to 40 assets by the MTBF (the lower the value the higher in rank to show) filtered by date range and asset classes. |
| B. Mean Time To Repair (MTTR) = CML/count of CM Up to 40 assets by the MTTR (the higher the value the higher in rank to show) filtered by date range and asset classes. |
| C. Mean Time To Intervene on CM (MTTI) = Average (Start time – Reported time) Up to 40 assets by the MTTI (the higher the value the higher in rank to show) filtered by date range and asset classes. |
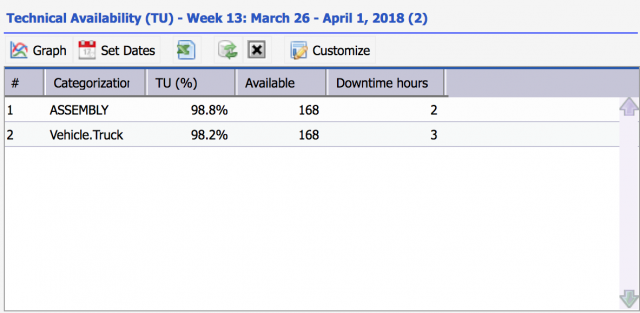
| D. (Deprecated) Technical Availability (TU) = ((AH-NAH)/(AH))*100% |
| E. (Deprecated) Reliability (Ry) = (OH/(OH+CMH))*100% |
| Resource Utilization |
| F. (Deprecated) Total Man Hours under Corrective Maintenance Type, and the its percentage of the total Man hours per asset class. |
| G. (Deprecated) Total Man Hours under Preventive Maintenance Type, and the its percentage of the total Man hours per asset class |
| H. (Deprecated) Total Man Hours under Reactive Maintenance Type (Emergency), and the its percentage of the total Man hours per asset class |
| I. Top asset by man hours – up to 40 top assets by labor hours optionally filtered by date range, and categories. |
| J. Top asset by downtime hours – up to 40 top assets by downtime optionally filtered by date range, and categories. |
Where:
- AH = Available hours per asset per week (24 x 7) = 168 hrs(fixed per week).
- NAH = The asset down time reported that asset was not capable of its specified function due to PM, CM.
- OH = Total operating hours per asset per week. This is from asset operation meter usage readings.
- In case OH is not configured or reported, available hours (AH above) will be used.
- CML = Labor time for
repair (from R2025f, August 2025).
- For a work order, the minimum start time of labor and maximum end time are used to determine the hours taken to repair.
- CMH = Total Corrective maintenance hours per asset. They are the downtime for work orders of corrective categories (category dropdowns with "Corrective" flag checked).
- Count EM = Count of Emergency maintenance work orders per asset per week.
The dashboard also includes the man power utilization per asset class.
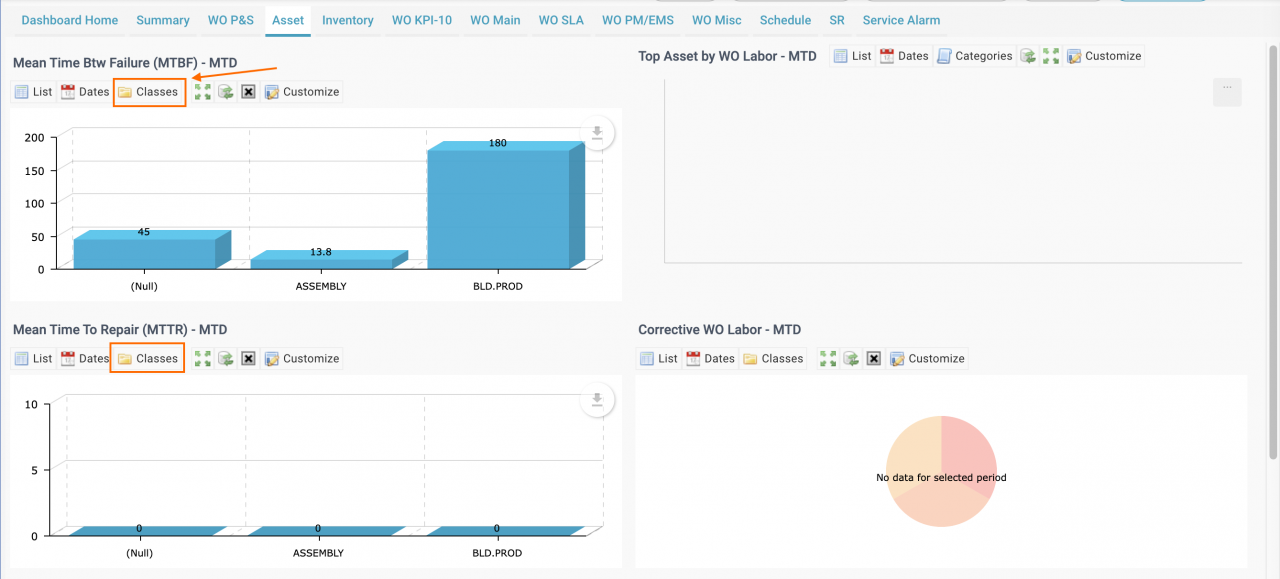
The following is a screenshot. The dashlets are located in "Asset" tab of the dashboard by default.
1. Drilldown
You can drill down by clicking "List" menu for a chart. A list view is presented. Click a list row to further drill down to the list of data contributing to that row.
2. No Data
A KPI chart may be blank due to lack of data. For instance, if there are no downtime in an asset category, that asset category will not show in the chart so that the graph is not flooded with classes of 100% availability.
3. Date Range
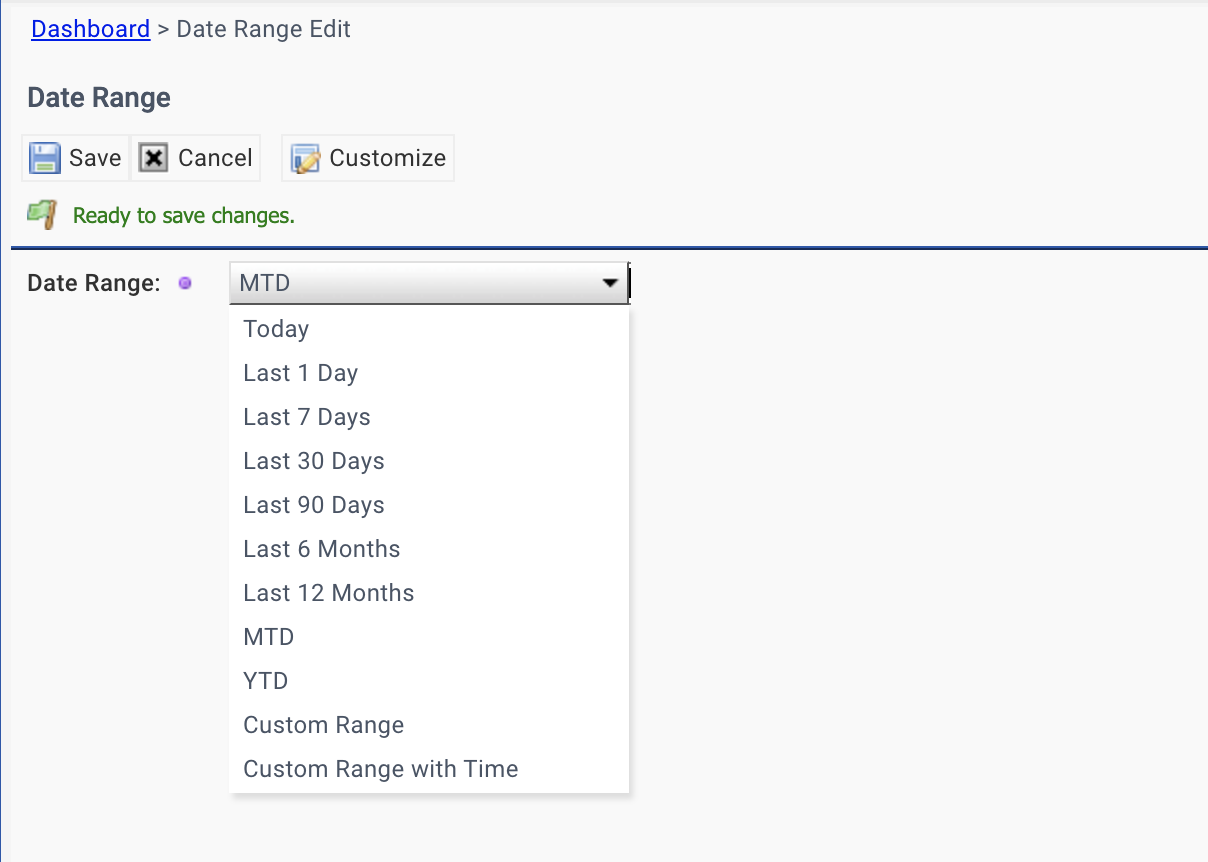
Use menu "Set Dates" to pick a date range for the dashboard. The default is "Current Week".
4. Classes
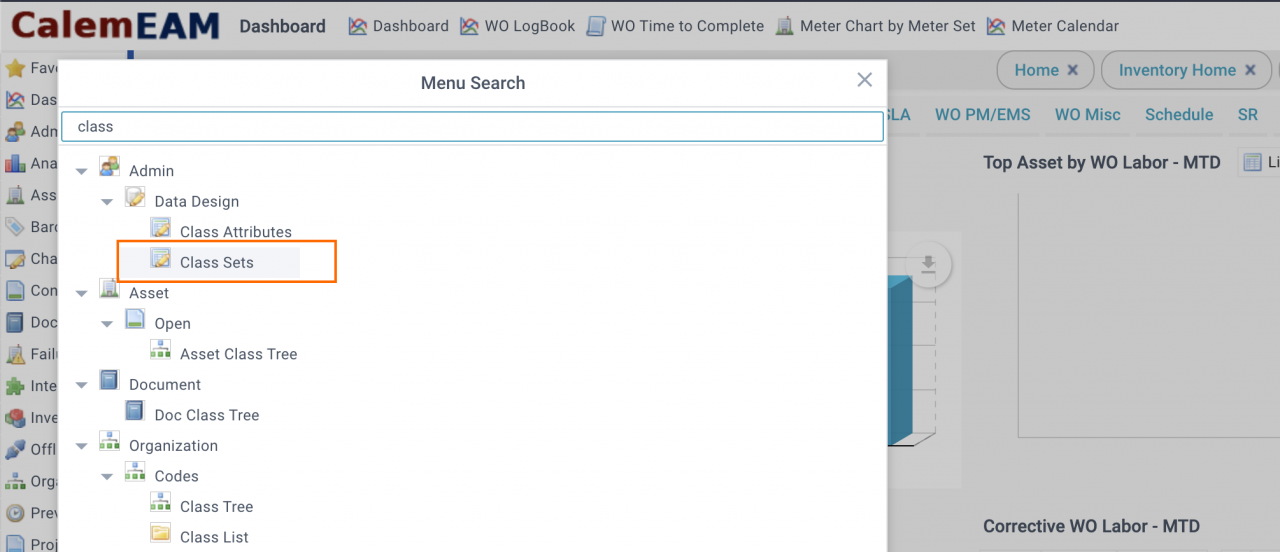
Class set can be configured so KPIs can be shown for a set of classes.
- Menu path: Admin | Data Design | Class Sets
5. Operation Meters
Operation meters may be configured for counting operational hours by meters. Alternatively, calendar hours will be used.
- Configure an "Operation Meter (hours)" – the meter tracks number of hours an asset has been operated. Edit an asset record and set an operation meter to use.
Additional resources
By accepting you will be accessing a service provided by a third-party external to https://calemeam.com/
