Calem Blogs
Blogs of CalemEAM
Visualizing Asset Outages on the Map
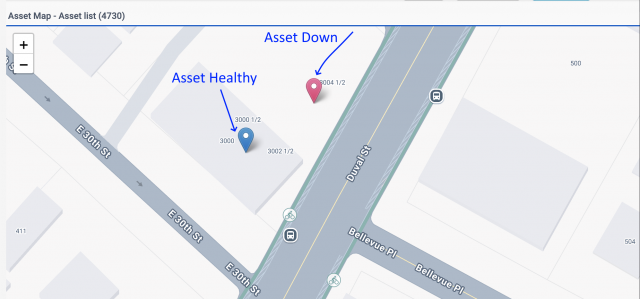
Failed assets can be visualized in the map in the coming release of R2025e (July 2025). Failed assets are shown in red markers while healthy assets in blue markers (screenshot below).
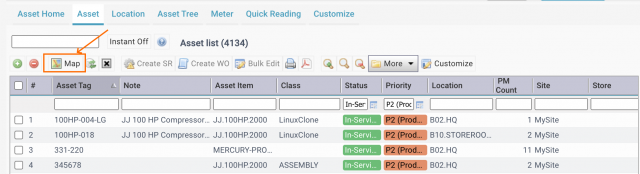
- Asset Map is launched from Asset | Asset List.
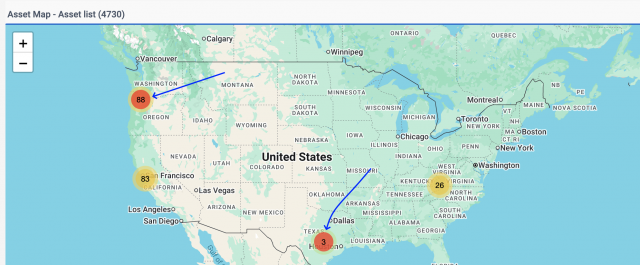
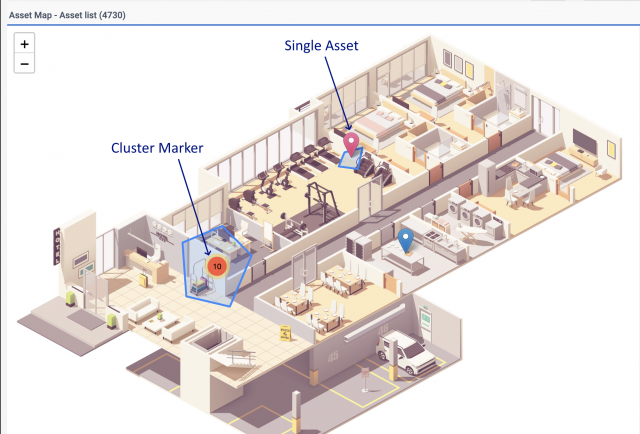
1. Clusters of Markers
Markers are clustered together for clarity by map scaling. A cluster marker is in red if any asset in the cluster failed. It is simple and intuitive for users to drill down to failed assets.
2. Floorplan Maps
Floorplans are images or blue prints of buildings. They can be digitized in Calem and used as maps. The visualization of failed assets is available to floorplan maps.
Additional Resources
- How to Set Up Multiple Maps in Calem
- How to Use Floorplans as Maps in Calem
- Set up Map Views in Calem
- Data Filtering/Search in Calem
- Add Free Text Search to a List View
- Expression in Free Text Search
- Saved Search in Calem
- List View Customization
- User Guide and Admin Guide (customer account required)
- Calem Enterprise Training Site
- Calem Enterprise Blogs
- Calem Enterprise demo
About the author

Related Posts
By accepting you will be accessing a service provided by a third-party external to https://calemeam.com/